
 Facebook
 Twitter
 Pinterest
 Copy Link


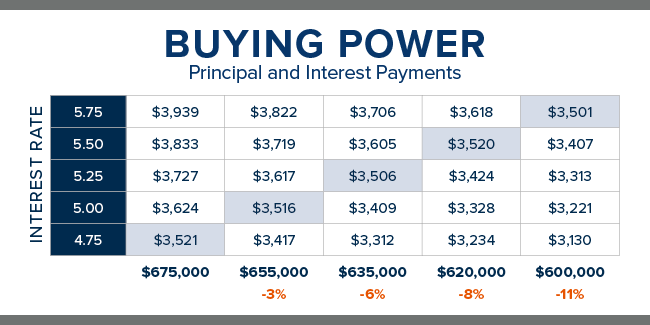
How Interest Rates Affect Buying Power
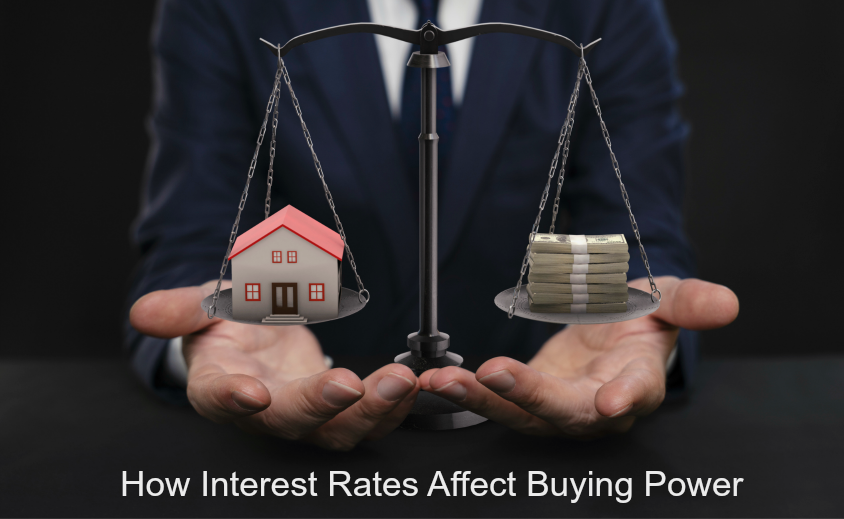

Whether you are thinking about buying or selling a home, interest rate trends are an important factor to consider. Mortgage interest rates have been rising and experts, including Windermere Chief Economist Matthew Gardner, predict that they will continue to increase in 2019.
Interest Rates and Buying Power
The chart below shows the impact rising interest rates would have if you planned to purchase a $675,000 home while keeping your principal and interest payments at $3,500 a month.
Every time interest rates increase by a quarter of a percent, your buying power decreases by about 3 percent.
What this means for buyers:
With prices moderating and interest rates slated to rise again, now is a good time to buy. If you’re betting on prices falling, you need to consider the strong possibility that an increase in interest rates would offset any potential price savings.
What this means for sellers:
Listing your home now means you will attract a larger buyer pool before interest rates rise.
Whether you’re thinking of buying or selling I can provide you market data that will help you make the best decision for your circumstances.
This post originally appeared on the WindermereEastside.com Blog.


Commute vs. Home Price Trade-Off: How Far Are You Willing To Drive?
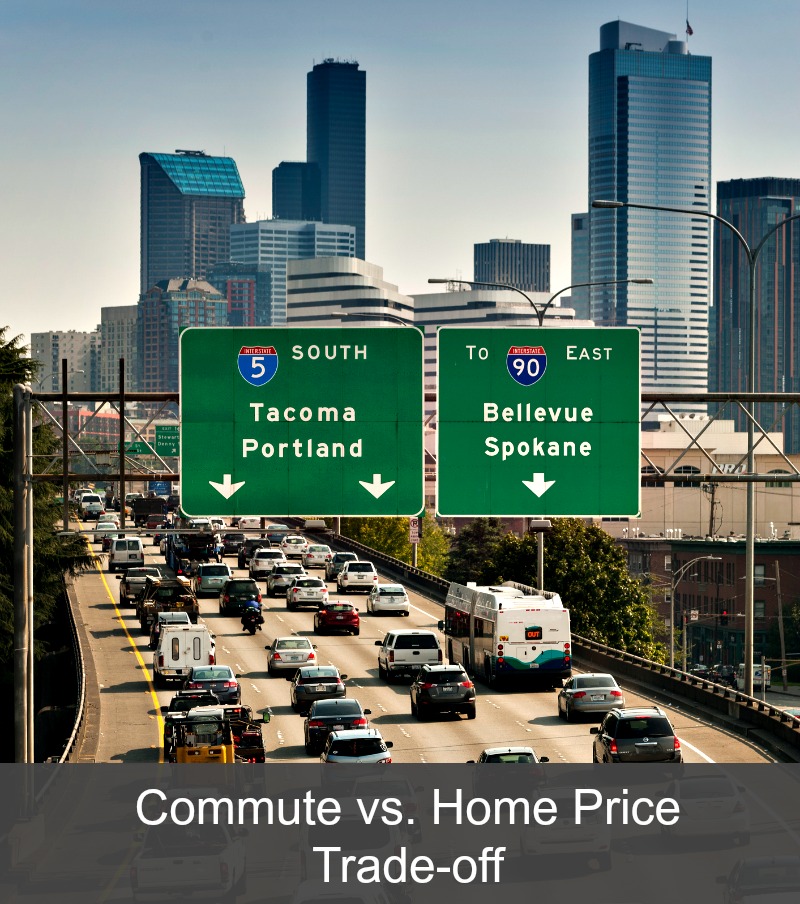

Housing Search Trade-Off: Price vs. Commute Time

Search for Homes by Commute Time on Windermere.com

Are you ready to look for a home?
I can help you choose the right area, narrow down your criteria, and create a strategy for getting you the home you want at a price you can afford.
This post originally appeared on the Windermere.com blog.
The Gardner Report – First Quarter 2018


The following analysis of the Western Washington real estate market is provided by Windermere Real Estate Chief Economist Matthew Gardner. We hope that this information may assist you with making better-informed real estate decisions.
Economic Overview
The Washington State economy added 96,900 new jobs over the past 12 months, representing an annual growth rate of 2.9%—still solidly above the national rate of 1.5%. Most of the employment gains were in the private sector, which rose by 3.4%. The public sector saw a more modest increase of 1.6%.
The strongest growth was in the Education & Health Services and Retail sectors, which added 17,300 and 16,700 jobs, respectively. The Construction sector added 10,900 new positions over the past 12 months.
Even with solid increases in jobs, the state unemployment rate held steady at 4.7%—a figure that has not moved since September of last year.
I expect the Washington State economy to continue adding jobs in 2018, but not at the same rate as last year given that we are nearing full employment. That said, we will still outperform the nation as a whole when it comes to job creation.
Home Sales Activity
- There were 14,961 home sales during the first quarter of 2018. This is a drop of 5.4% over the same period in 2017.
- Clallam County saw sales rise the fastest relative to the first quarter of 2017, with an increase of 16.5%. In most of the other markets, the lack of available homes for sale slowed the number of closings during this period.
- Listing inventory in the quarter was down by 17.6% when compared to the first quarter of 2017, but pending home sales rose by 2.6% over the same period, suggesting that closings in the second quarter should be fairly robust.
- The takeaway from this data is that the lack of supply continues to put a damper on sales. I also believe that the rise in interest rates in the final quarter of 2017 likely pulled sales forward, leading to a drop in sales in the first quarter of 2018.

Home Prices
 With ongoing limited inventory, it’s not surprising that the growth in home prices continues to trend well above the long-term average. Year-over-year, average prices rose 14.4% to $468,312.
- Economic vitality in the region is leading to robust housing demand that far exceeds supply. Given the relative lack of new construction homes— something that is unlikely to change any time soon—there will continue to be pressure on the resale market. As a result, home prices will continue to rise at above-average rates in the coming year.
- When compared to the same period a year ago, price growth was strongest in Grays Harbor County at 27.5%. Ten additional counties experienced double-digit price growth.
- Mortgage rates continued to rise during first quarter, and are expected to increase modestly in the coming months. By the end of the year, interest rates will likely land around 4.9%, which should take some of the steam out of price growth. This is actually a good thing and should help address the challenges we face with housing affordability—especially in markets near the major job centers.

Days on Market
- The average number of days it took to sell a home dropped by seven days when compared to the same quarter of 2017.
- King County continues to be the tightest market in Western Washington, with homes taking an average of 24 days to sell. Every county in the region saw the length of time it took to sell a home either drop or remain essentially static relative to the same period a year ago.
- In looking at the entire region, it took an average of 61 days to sell a home in the first quarter of this year. This is down from 68 days in the first quarter of 2017 but up by eleven days when compared to the fourth quarter of 2017.
- Anyone expecting to see a rapid rise in the number of homes for sale in 2018 will likely be disappointed. New construction permit activity—a leading indicator—remains well below historic levels and this will continue to put increasing pressure on the resale home market.

Conclusions
 This speedometer reflects the state of the region’s housing market using housing inventory, price gains, home sales, interest rates, and larger economic factors. For the first quarter of 2018, I have left the needle at the same point as fourth quarter of last year. Price growth remains strong even as sales activity slowed. All things being equal, 2018 is setting itself up to be another very good year for sellers but, unfortunately, not for buyers who will still see stiff competition for the limited number of available homes for sale.
 Matthew Gardner is the Chief Economist for Windermere Real Estate, specializing in residential market analysis, commercial/industrial market analysis, financial analysis, and land use and regional economics. He is the former Principal of Gardner Economics, and has more than 30 years of professional experience both in the U.S. and U.K.
This article originally appeared on the Windermere.com blog.
