The Gardner Report – Q2 2018


The following analysis of the Western Washington real estate market is provided by Windermere Real Estate Chief Economist Matthew Gardner. We hope that this information may assist you with making better-informed real estate decisions.
Economic Overview
The Washington State economy added 83,900 new jobs over the past 12 months, representing an annual growth rate of 2.5%. This is a slowdown from the last quarter, but employment growth remains well above the national rate of 1.6%. Employment gains continue to be robust in the private sector, which was up by 2.8%. The public sector (government) grew by a more modest 1.1%.
The strongest growth sectors were Retail Trade and Construction, which both rose by 4.8%. Significant growth was also seen in the Education & Health Services and Information sectors, which rose by 3.9% and 3.4%, respectively.
The State’s unemployment rate was 4.7%, down from 4.8% a year ago. Washington State will continue adding jobs for the balance of the year and I anticipate total job growth for 2018 will be around 80,000, representing a total employment growth rate of 2.4%.
Home Sales Activity
-
There were 23,209 home sales during the second quarter of 2018. This is a drop of 2.3% compared to the same period a year ago.
-
Clallam County saw sales rise the fastest relative to the same period a year ago, with an increase of 12.6%. Jefferson County also saw significant gains in sales at 11.1%.
-
The number of homes for sale last quarter was down by a nominal 0.3% when compared to the second quarter of 2017, but up by 66% when compared to the first quarter of this year. Much has been mentioned regarding the growth in listings, but it was not region-wide. King County saw a massive 31.7% increase in inventory, though all but three of the other counties covered in this report saw the number of listings drop compared to a year ago.
-
The takeaway from this data is that while some counties are seeing growth in listings — which will translate into sales down the road — the market is still out of balance.

Home Prices
-
 As inventory is still fairly scarce, growth in home prices continues to trend well above the long-term average. Prices in Western Washington rose 12.2% over last year to $526,398.
 -
Home prices continue to trend higher across Western Washington, but the pace of growth has started to slow. This should please would-be buyers. The spring market came late but inventory growth in the expensive King County market will give buyers more choices and likely lead to a slowing down of price growth as bidding wars continue to taper.
-
When compared to the same period a year ago, price growth was strongest in Mason County, which was up 17.4%. Eleven other counties experienced double-digit price growth.
-
Mortgage rates, which had been rising significantly since the start of the year, have levelled off over the past month. I believe rising rates are likely the reason that inventory levels are rising, as would-be sellers believe that this could be the right time to cash out. That said, the slowing in rate increases has led buyers to believe that rates will not jump soon, which gives them a little more breathing room. I do not expect to see any possible slowdown in demand until mortgage rates breach the 5% mark.
Days on Market
-
The average number of days it took to sell a home dropped by seven days compared to the same quarter of 2017.
-
King County continues to be the tightest market in Western Washington, with homes taking an average of only 13 days to sell. Every county in the region other than Clallam saw the length of time it took to sell a home drop when compared to the same period a year ago.
-
Across the entire region, it took an average of 41 days to sell a home in the second quarter of this year. This is down from 48 days in the second quarter of 2017 and down by 20 days when compared to the first quarter of 2018.
-
Although we did see some inventory increases when compared to the first quarter of the year, we are essentially at the same level of homes on the market as a year ago. The market has yet to reach equilibrium and I certainly do not expect to reach that point until sometime in 2019.

Conclusions

This speedometer reflects the state of the region’s real estate market using housing inventory, price gains, home sales, interest rates, and larger economic factors. For the second quarter of 2018, I have moved the needle very slightly towards buyers, but it remains firmly a seller’s market. This shift is a function of price growth tapering very slightly, as well as the expectation that we should see more homes come on the market as we move through the balance of the year.

Matthew Gardner is the Chief Economist for Windermere Real Estate, specializing in residential market analysis, commercial/industrial market analysis, financial analysis, and land use and regional economics. He is the former Principal of Gardner Economics, and has more than 30 years of professional experience both in the U.S. and U.K.
This post originally appeared on the Windermere.com Blog.
Economists Predict: Recession Coming


The local economy is booming, and nationally we are experiencing the second-longest bull market in history. That’s great news, but it can’t last forever. The economy runs in cycles and we’re long overdue for our overheated market to cool down a bit. According to a survey of top economists by Zillow, almost half of experts said they expect the next recession to begin some time in 2020.
Experts Say Recession Could Hit by Early 2020

A Recession Means a Slow-Down, Not a Crisis
A recession means the economy has slowed down. It does not mean we are experiencing another housing crisis. The housing crash of 2008 caused the last recession. However, that crash was primarily due to faulty lending practices that encouraged people to purchase homes they could not afford. Current lending practices make that unlikely to occur today.
Housing Won’t Be the Problem
According to economists, monetary and trade policy are the most likely triggers for the next recession, not housing.
“If a recession is to occur, it is unlikely to be caused by housing-related activity, and therefore the housing sector should be one of the leading sources to come out of the recession.” – Mark Fleming, chief economist for First American
The last recession that was caused by the housing crash was an anomaly. During the previous five recessions home values actually appreciated. If the US experiences a recession you can expect a slow-down of home price increases, not a housing crisis.
Whether you’re thinking about buying or selling, it’s important to have the most current information about the market. I can provide you with statistics and economic forecasts, as well as answers to any questions you may have.
This post originally appeared on the WindermereEastside.com Blog.
Commute vs. Home Price Trade-Off: How Far Are You Willing To Drive?


Housing Search Trade-Off: Price vs. Commute Time

Search for Homes by Commute Time on Windermere.com
Are you ready to look for a home?
I can help you choose the right area, narrow down your criteria, and create a strategy for getting you the home you want at a price you can afford.
This post originally appeared on the Windermere.com blog.
Three Deck Design Ideas To Get Your Yard Ready For Summer
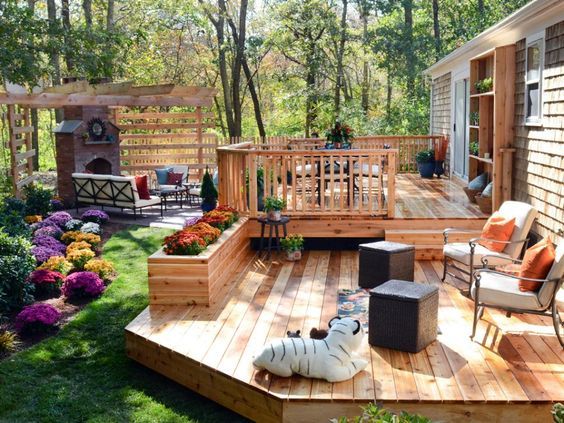
A delightfully warm spring in many parts of the Western U.S. has many folks brushing off their summer clothing early. While this is exciting for all who love the outdoors, public spaces like parks and beaches may be overcrowded. What better time, then, to focus on ways to maximize the space you have in your own home. There’s no one ideal way to design or set up your deck, but we’ve put together a few of our favorite ideas to help inspire your next redesign.
Multi-level Decks

Credit: H. Camille Smith / HGTV
-Especially if your square footage is limited, tiering your deck into multiple levels is a great way to incorporate extra outdoor space into your home.
-By separating your deck into multiple levels, even slightly, you can create a cozy sense of separation between spaces.
-Give yourself options for privacy. Depending on your property, the base level of your deck may be below your fence-line. If you have a view you’d like to enjoy with your barbecue, consider a second tier.
Built-in Seating

Credit: lizmarieblog.com
-A simple way to save space and hassle is to build in your seating spaces during your deck’s construction.
-It’s important to consider what you will predominantly be doing on your deck. Lounging while reading? A corner bench is a great fit and can be outfitted comfortably. Potlucks and cookouts? Consider higher benches or fences with wide tops for easy plate placement.
-Consider your environment. If your deck will weather rain, sand, or wind consistently, don’t write off surfaces like brick and concrete, which can be framed as appealingly as wood or other stone.
Custom Lighting

Credit: istikharawazifa.com
-As the sun fades, your deck’s utility can shine or fade with it. Including discreet lighting within the construction of your deck is a small step that can pay huge dividends.
-Increasingly popular low-voltage systems have made a well-lit backyard and deck drastically more affordable.
-Depending on your location, solar powered lighting is a worthwhile investment that can help accentuate your stairs, fences, and other outdoor decorations.
This post originally appeared on the Windermere.com Blog.
The Gardner Report – First Quarter 2018


The following analysis of the Western Washington real estate market is provided by Windermere Real Estate Chief Economist Matthew Gardner. We hope that this information may assist you with making better-informed real estate decisions.
Economic Overview
The Washington State economy added 96,900 new jobs over the past 12 months, representing an annual growth rate of 2.9%—still solidly above the national rate of 1.5%. Most of the employment gains were in the private sector, which rose by 3.4%. The public sector saw a more modest increase of 1.6%.
The strongest growth was in the Education & Health Services and Retail sectors, which added 17,300 and 16,700 jobs, respectively. The Construction sector added 10,900 new positions over the past 12 months.
Even with solid increases in jobs, the state unemployment rate held steady at 4.7%—a figure that has not moved since September of last year.
I expect the Washington State economy to continue adding jobs in 2018, but not at the same rate as last year given that we are nearing full employment. That said, we will still outperform the nation as a whole when it comes to job creation.
Home Sales Activity
- There were 14,961 home sales during the first quarter of 2018. This is a drop of 5.4% over the same period in 2017.
- Clallam County saw sales rise the fastest relative to the first quarter of 2017, with an increase of 16.5%. In most of the other markets, the lack of available homes for sale slowed the number of closings during this period.
- Listing inventory in the quarter was down by 17.6% when compared to the first quarter of 2017, but pending home sales rose by 2.6% over the same period, suggesting that closings in the second quarter should be fairly robust.
- The takeaway from this data is that the lack of supply continues to put a damper on sales. I also believe that the rise in interest rates in the final quarter of 2017 likely pulled sales forward, leading to a drop in sales in the first quarter of 2018.

Home Prices
 With ongoing limited inventory, it’s not surprising that the growth in home prices continues to trend well above the long-term average. Year-over-year, average prices rose 14.4% to $468,312.
- Economic vitality in the region is leading to robust housing demand that far exceeds supply. Given the relative lack of new construction homes— something that is unlikely to change any time soon—there will continue to be pressure on the resale market. As a result, home prices will continue to rise at above-average rates in the coming year.
- When compared to the same period a year ago, price growth was strongest in Grays Harbor County at 27.5%. Ten additional counties experienced double-digit price growth.
- Mortgage rates continued to rise during first quarter, and are expected to increase modestly in the coming months. By the end of the year, interest rates will likely land around 4.9%, which should take some of the steam out of price growth. This is actually a good thing and should help address the challenges we face with housing affordability—especially in markets near the major job centers.

Days on Market
- The average number of days it took to sell a home dropped by seven days when compared to the same quarter of 2017.
- King County continues to be the tightest market in Western Washington, with homes taking an average of 24 days to sell. Every county in the region saw the length of time it took to sell a home either drop or remain essentially static relative to the same period a year ago.
- In looking at the entire region, it took an average of 61 days to sell a home in the first quarter of this year. This is down from 68 days in the first quarter of 2017 but up by eleven days when compared to the fourth quarter of 2017.
- Anyone expecting to see a rapid rise in the number of homes for sale in 2018 will likely be disappointed. New construction permit activity—a leading indicator—remains well below historic levels and this will continue to put increasing pressure on the resale home market.

Conclusions
 This speedometer reflects the state of the region’s housing market using housing inventory, price gains, home sales, interest rates, and larger economic factors. For the first quarter of 2018, I have left the needle at the same point as fourth quarter of last year. Price growth remains strong even as sales activity slowed. All things being equal, 2018 is setting itself up to be another very good year for sellers but, unfortunately, not for buyers who will still see stiff competition for the limited number of available homes for sale.
 Matthew Gardner is the Chief Economist for Windermere Real Estate, specializing in residential market analysis, commercial/industrial market analysis, financial analysis, and land use and regional economics. He is the former Principal of Gardner Economics, and has more than 30 years of professional experience both in the U.S. and U.K.
This article originally appeared on the Windermere.com blog.
 Facebook
 X
X
 Pinterest
 Copy Link
